Playoff hockey in the NHL is a completely different beast than the regular season. There is more intensity with every hit. Defenders sacrifice their bodies to block pucks more often. The entire scope of every playoff game just feels like a do-or-die moment. This brings up a question: how much of a difference between regular season and playoff hockey can we see in the data?
What’s in the Data?
The data set has 11,195 observations (or games) that went all the way back to 2008. It comes from a concatenation of data from this historical archive of scores. Included in this set are money lines, spreads, and over/under data on every one of the games. With all of this information, it’s very easy to get a cross section on just about any type of analysis that we’d want.
NHL Scoring Trends
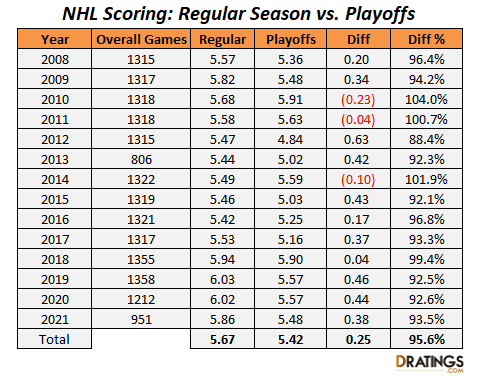
Here is the breakdown of scoring between the regular season and playoffs from 2008 to 2021…

Looking only at the comparison between these two factors, we find that there are a few interesting things of note. First, in only three out of fourteen years was scoring higher in the NHL Playoffs versus the regular season. Second, on average, scoring goes down by 4.4% in the NHL Playoffs. This effect has been even more noticeable in the most recent three years where it was down more than 7%. Consequently, it’s pretty clear that there is a “playoff effect” at play here.
Is There an Angle to Play Unders in the NHL Playoffs?
With scoring in the playoffs down, people sometimes assume that this would make for a good under bet. For any trend in betting to have validity, a few things have to be true. One, is that there is indeed a trend and that the variable analyzed isn’t just a random aberration. Two, if the bookies know and account for the trend then there is no advantage to the bettor.
It’s pretty apparent that there is indeed a significant drop in scoring in the playoffs. I don’t need to run any fancy statistical tests because a 4.4% difference over the course of thousands of games in clearly significant. Thus, we do find in this first test that there is a trend. Next, do the sportsbooks know about this trend? This is a harder question to answer. I find that just taking the record against an arbitrary line and reporting the units on that bet can be a little misleading for a variety of reasons.
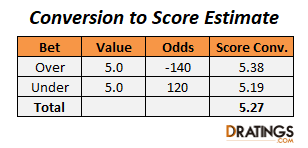
My method is to take the over, under and odds of each game, convert it to a score and compare variables. For example, if the over is 5.0 (-140) and the under is 5.0 (+120), we do the following to get the sportsbook estimate on the true even odds over/under:

In this manner, we are able to get the closing line value and convert it to an estimated score. We know that the average scores have gone down 4.4% over the past fourteen years. This is the metric that we need to compare against sportsbooks. In essence, we want to know if the sportsbook projections have gone down to that level or not. The answer:

The sportsbooks are very much on top of this trend. In fact, they perfectly match the 4.4% drop that we found in the actual scoring. So the conclusion is that there is no edge here.
Score By Playoff Game
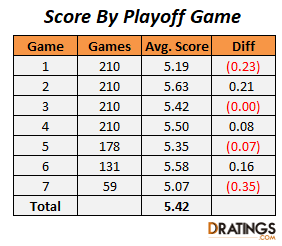
An other thing that I wanted to analyze was the differences in score per game. A very interesting observation is just how much significantly lower scores are in the Game 7’s of Stanley Cup Playoff series. There is also a relatively significant difference in both Game 1 and Game 2. All of these trends seem to have reasonable explanations. In Game 7 (and likely Game 1), players could be a little more tentative than usual. With less risk aversion on the ice comes less goals. Referees are also much more likely to swallow their whistles. This leads to less power plays and less goals. Further, there is the effect that more physical play and holding will keep scores suppressed as well.