Similarly to hockey, there appears to be a different feel to the game once the regular season ends and the NBA Playoffs begin. The games seem to go from high-paced, back-and-forth action to a more methodical game dominated by defensive intensity. This is the theory, at least. In essence, this begs us to question just how much different playoff basketball is compared to the regular season. Thankfully, we have troves of data and can answer this question!
What’s in the Data?
Our data comes from this historical archive of scores which is truly a treasure trove worth of information. The data set has 18,986 observations (or games) that goes all the way back to 2008. The data includes 17,887 regular
season games and 1,199 playoff games. For this analysis, I made the difficult decision to simply remove the playoff game information from the 2019-2020 season. These NBA Playoffs were played on a neutral court in Orlando during the response to the Covid-19. There were just too many extraneous circumstances in this data to be valuable to our analysis. Also included in this set are money lines, spreads, and over/under data on every one of the games.
NBA Scoring Trends
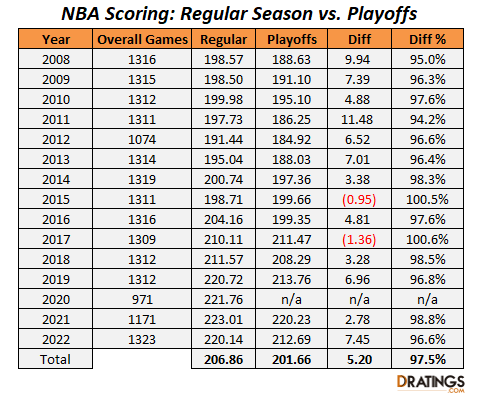
Below is what the table of scoring looks like between the regular season and NBA Playoffs from 2008 to 2022. It should also be noted here how overtime is handled in the data. Overtime can be problematic as it can create massive outliers, and thus, heavily skew the results. Essentially, to normalize that factor, I simply took the scores after 48 minutes.

After removing the 2020 season, we find that there are two seasons out of fourteen where scoring barely increased in the NBA Playoffs compared to the regular season. Overall, however, there is a massive drop in scoring to the tune of 2.5% or just over five points a game over the course of the last fifteen years. With our massive sample sizes, I don’t even need to run a statistical test to determine that there is a clear significant difference here.
Is There an Angle to Play Unders in the NBA Playoffs?
 Short Answer: Maybe!
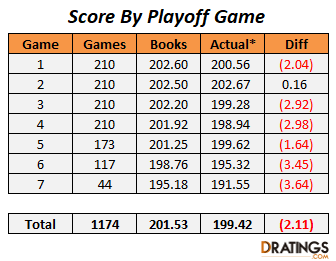
There are absolutely some interesting trends in this data that could amount to a playable bet. Again, I’d like to place a disclaimer here that the “Actual” number is only the score through 48 minutes. Thus, it is slightly misleading to consider it conclusive that the under is always the bet to place. Being that the sportsbooks shoot for the median to get action on both sides, it is still more useful to use the score at 48 minutes, in my opinion.
Anyways, the area that I do want to reflect on is the change is scoring over the course of a series. One can see from the sportsbook over/unders and from the actual results that scoring drops as the series goes on. Games 1 and 2 are the games with the highest scoring. Games 3 through 5 have a slight drop off as teams tighten up slightly. However, we see a huge drop off of scoring in Game 6, and then, an even further drop in Game 7. Interestingly, the sportsbooks don’t seem to account for a drop in scoring until Game 5 with roughly a 1 point drop. They then see the Game 6 effect as around a 3.75 point drop from the start of the series, and Game 7 as a 7.3 point drop. The actual data shows these drops in Game 6 and 7 to be around 6 points and 10 points, respectively. This, leads me to conclude that the sportsbooks are overly conservative on this trend.
Conclusion on Betting Angle
So, is there a bet? Yes, if the sportsbooks only move the over/under by 2.5 points or less from Game 5 to Game 6, then there is a play. Further, the same can be said if the over/under drop is 5.5 points or less from Game 5 to Game 7. Obviously, the bettor must make sure that there are no other factors at play that can affect the over/under. (i.e. player injuries, etc.)