Below are the Donchess Inference Index computer simulated results that give us our NBA season prediction. The NBA schedule was simulated 1000 times based on real data from the our NBA Team Ratings and how they have done so far in the NBA season. One will find expected win total for all the NBA teams, the probability of winning their division, the probability of winning their conference and the probability of winning the NBA Championship. These odds will change and be updated as the season progresses.
This NBA season prediction takes into account all the basic tiebreaker and playoff rules. Starting in this 2015-16 season, the division champions no longer will occupy the top three spots of their conference in the playoffs. The seeding from one to eight will now be done based on overall record within the conference.
As always, we also provide our NBA Game Predictions. These are available for a more detailed break down of the individual games coming up.
Original Posting: 10/22/2015
Last simulation was done on 4/2/2016.
The Warriors have a 50.5% chance of getting 73+ wins.
NBA Season Prediction – Expected Win Total and Odds to Win Division
| Atlantic | Wins | Losses | Proj Wins | Proj Losses | Prob to Win Division | ML on Winning Div |
|---|---|---|---|---|---|---|
| Toronto | ||||||
| Boston | ||||||
| New York | ||||||
| Brooklyn | ||||||
| Philadelphia | ||||||
| Central | Wins | Losses | Proj Wins | Proj Losses | Prob to Win Division | ML on Winning Div |
| Cleveland | ||||||
| Indiana | ||||||
| Detroit | ||||||
| Chicago | ||||||
| Milwaukee | ||||||
| Southeast | Wins | Losses | Proj Wins | Proj Losses | Prob to Win Division | ML on Winning Div |
| Atlanta | ||||||
| Miami | ||||||
| Charlotte | ||||||
| Washington | ||||||
| Orlando | ||||||
| Northwest | Wins | Losses | Proj Wins | Proj Losses | Prob to Win Division | ML on Winning Div |
| Oklahoma City | ||||||
| Portland | ||||||
| Utah | ||||||
| Denver | ||||||
| Minnesota | ||||||
| Pacific | Wins | Losses | Proj Wins | Proj Losses | Prob to Win Division | ML on Winning Div |
| Golden State | ||||||
| LA Clippers | ||||||
| Sacramento | ||||||
| Phoenix | ||||||
| LA Lakers | ||||||
| Southwest | Wins | Losses | Proj Wins | Proj Losses | Prob to Win Division | ML on Winning Div |
| San Antonio | ||||||
| Memphis | ||||||
| Houston | ||||||
| Dallas | ||||||
| New Orleans |
NBA Season Prediction – To Make Playoffs, Win Conference, and Win Championship
| Atlantic | Playoff % | ML Playoffs | Conf Win % | ML Conf Win | NBA Champ Win % | ML on NBA Champ |
|---|---|---|---|---|---|---|
| Central | Playoff % | ML Playoffs | Conf Win % | ML Conf Win | NBA Champ Win % | ML on NBA Champ |
| Southeast | Playoff % | ML Playoffs | Conf Win % | ML Conf Win | NBA Champ Win % | ML on NBA Champ |
| Northwest | Playoff % | ML Playoffs | Conf Win % | ML Conf Win | NBA Champ Win % | ML on NBA Champ |
| Pacific | Playoff % | ML Playoffs | Conf Win % | ML Conf Win | NBA Champ Win % | ML on NBA Champ |
| Southwest | Playoff % | ML Playoffs | Conf Win % | ML Conf Win | NBA Champ Win % | ML on NBA Champ |
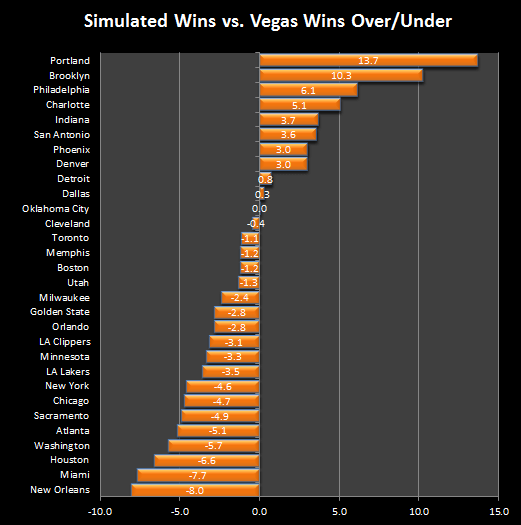
Preseason NBA Simulated Wins vs. Vegas Over/Under
There are a lot of unknowns before the season starts as players change teams, coaches get fired, etc. Though the simulation is admittedly shaky because of these conditions, we attempt to adjust the team’s chances of winning by using player values to give teams a bump to the positive or negative. This year, the biggest adjustment up goes to Oklahoma City as they will get Kevin Durant back after playing under 30 games last year, and the biggest adjustment down goes to Portland around the loss of LaMarcus Aldridge.
In the graph below, we take a look at the biggest differences between the DRatings simulated seasons and our “Vegas” over/under which comes from 5Dimes. A positive number signifies that the simulation shows a higher number of wins than Vegas, and a low number the opposite.
